Energy
Generate images like this by single click. Just edit the text and regenerate the image to get a new one.
Generate images for energy-saving practices and traditional energy use.
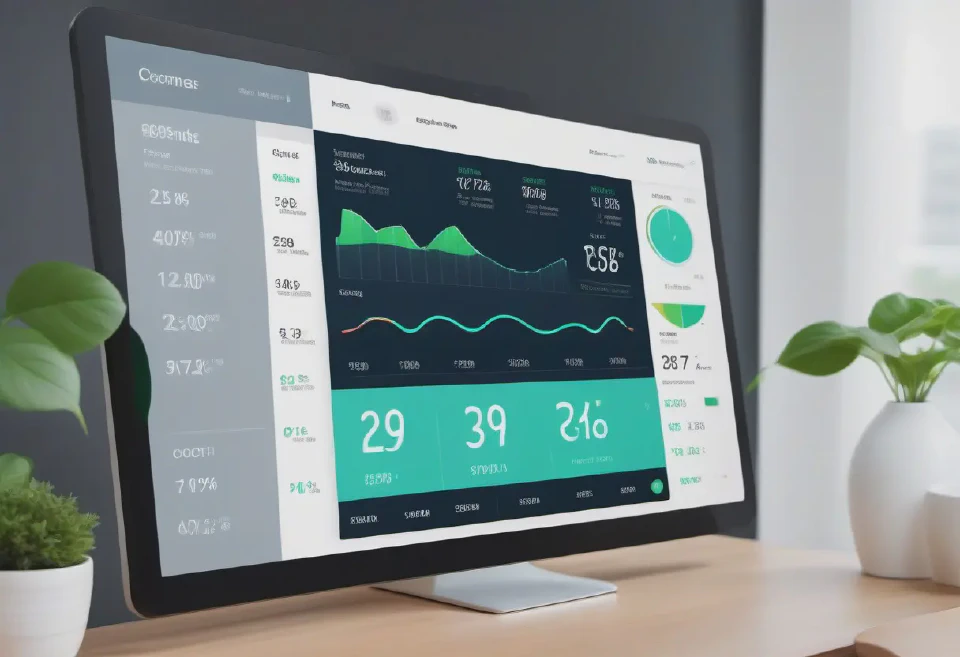
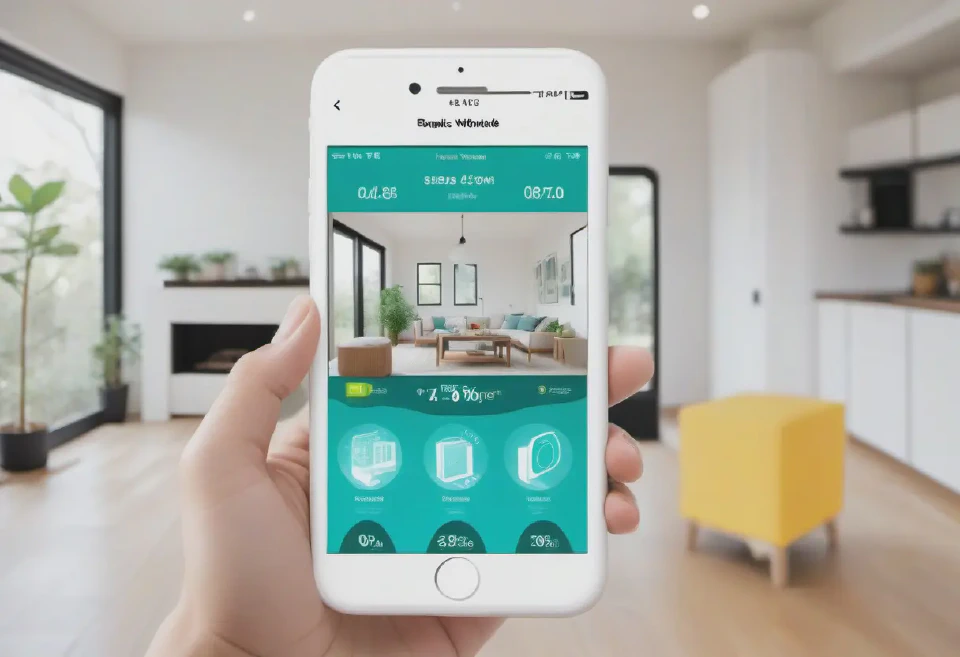
A digital dashboard interface showing real-time energy usage, cost analytics, and savings for a household or business, with touch-friendly UI and smooth animated transitions between data points.
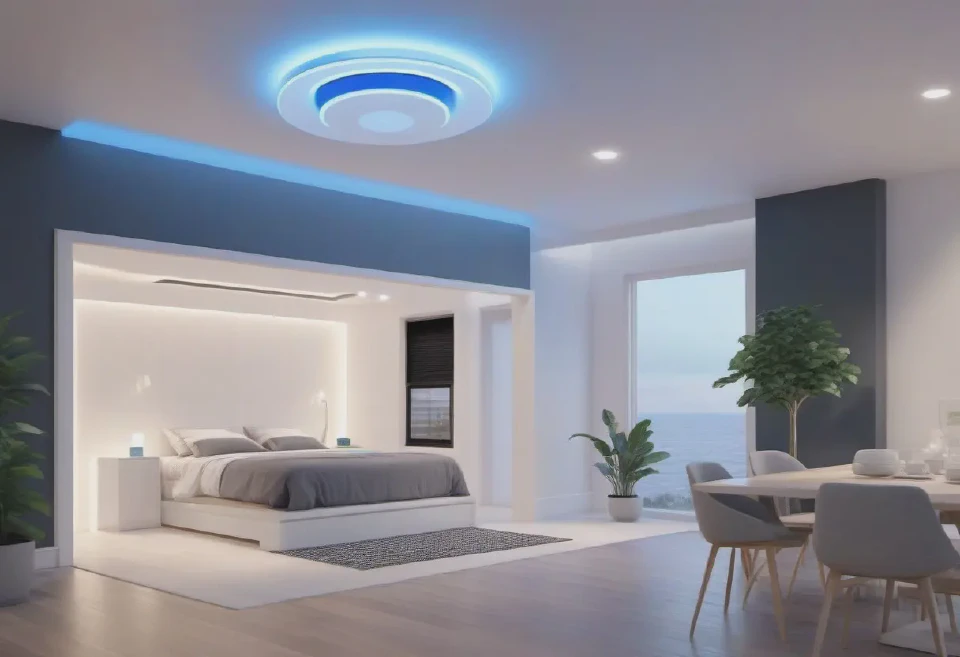
A 3D rendered animation of a smart home system in action, highlighting how it optimally adjusts lighting, heating, and cooling to minimize energy usage.
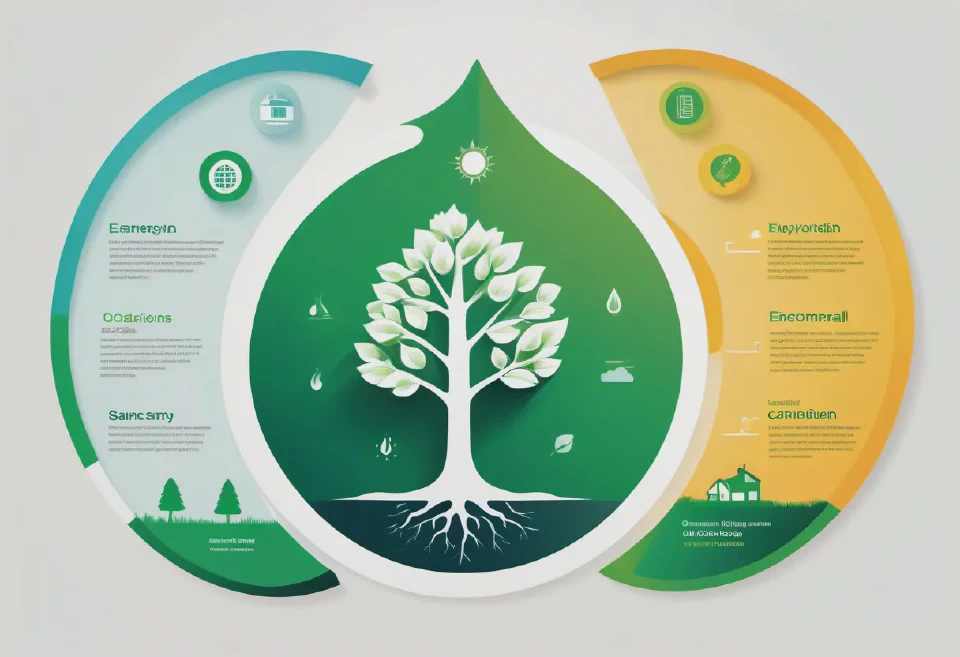
An infographic illustrating a year's worth of energy savings through the lens of environmental impact, utilizing icons of trees, water, and carbon footprint reductions, executed in a minimalistic, clean design style.
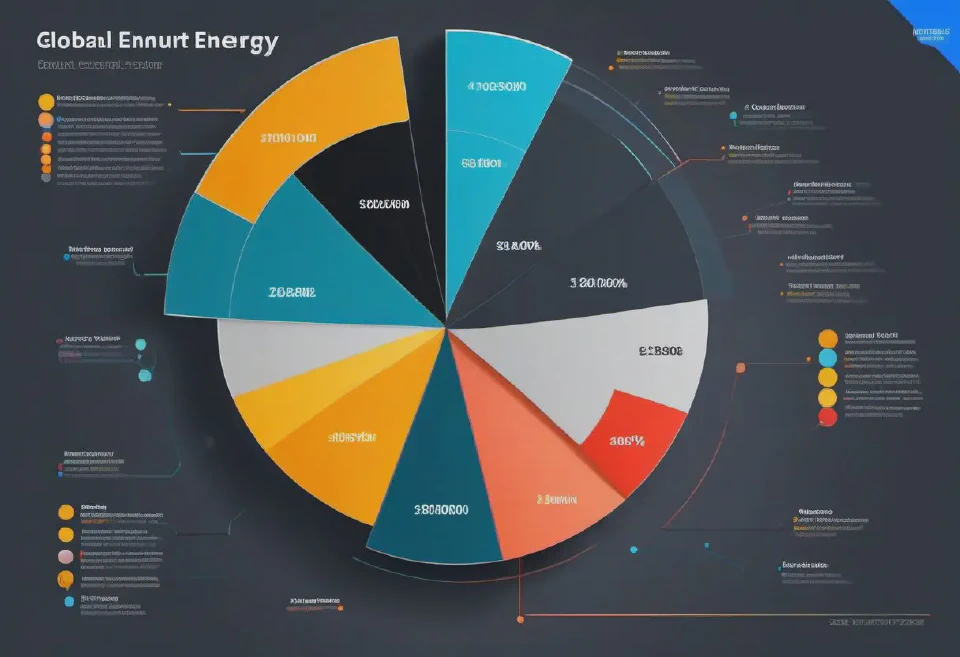
A multi-level donut chart presenting a breakdown of global energy production by source (solar, wind, hydro, nuclear, coal, oil, and natural gas) and within each source by country, for the year 2023. Implement interactive segmentation allowing users to delve into each energy source and view the top contributing countries. Use distinct and harmonious color schemes for clear differentiation between sources and countries. Present the chart with high definition and smooth animation transitions suitable for educational and professional presentations.
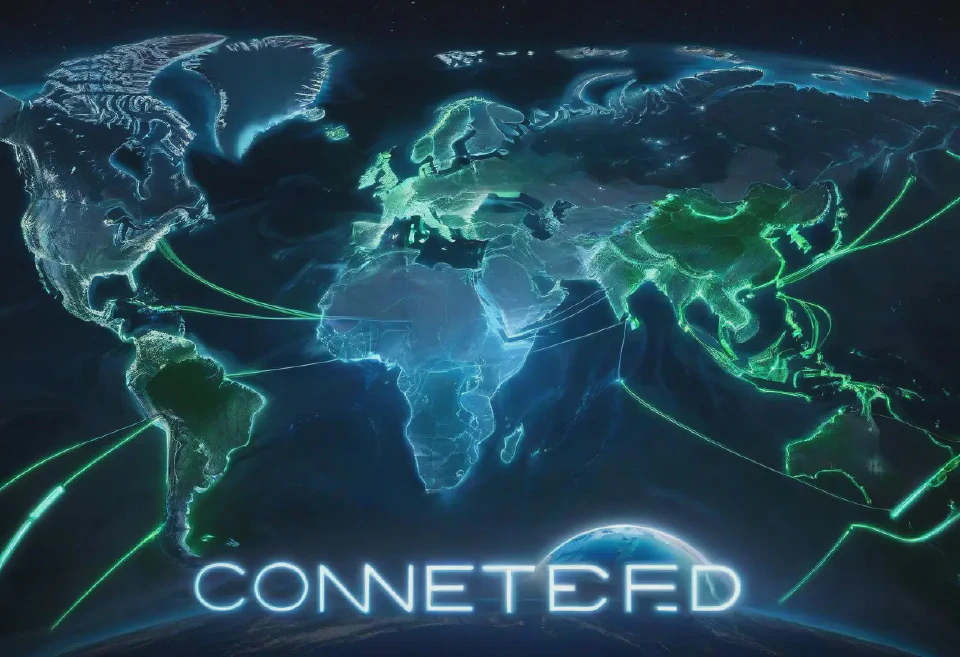
An illustration of the Earth from space, highlighting the electric grid connections across continents with glowing lines. The continents are dark, but the grid is illuminated in vibrant blue and green, symbolizing renewable energy sources. The words "Connected Planet" appear in a sleek, clean font at the bottom.
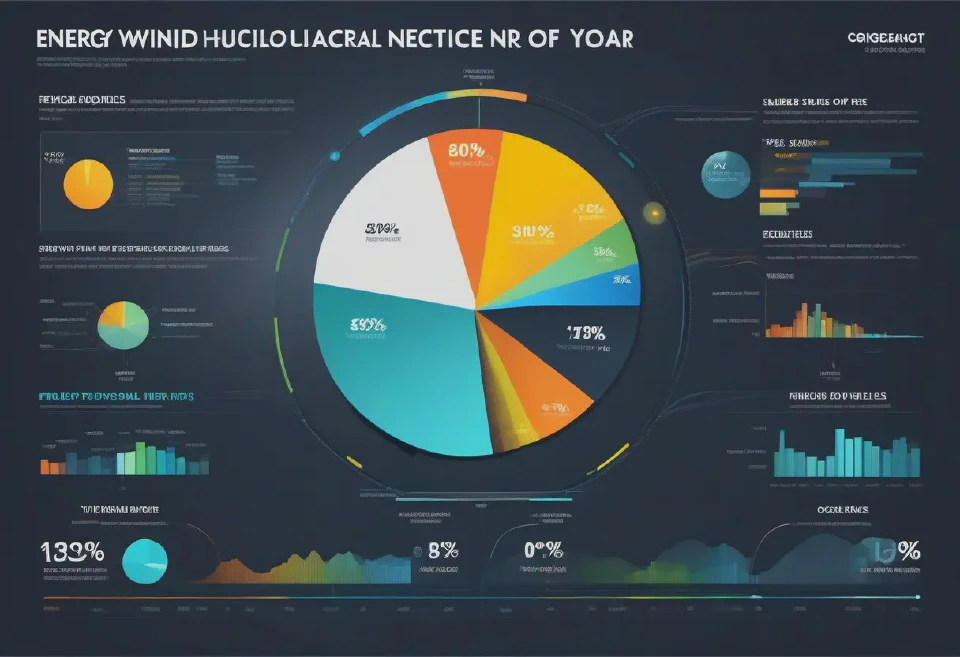
A dynamic pie chart displaying the percentage breakdown of energy sources (solar, wind, hydro, fossil fuels, and nuclear) used over the year, with a sleek, futuristic interface.
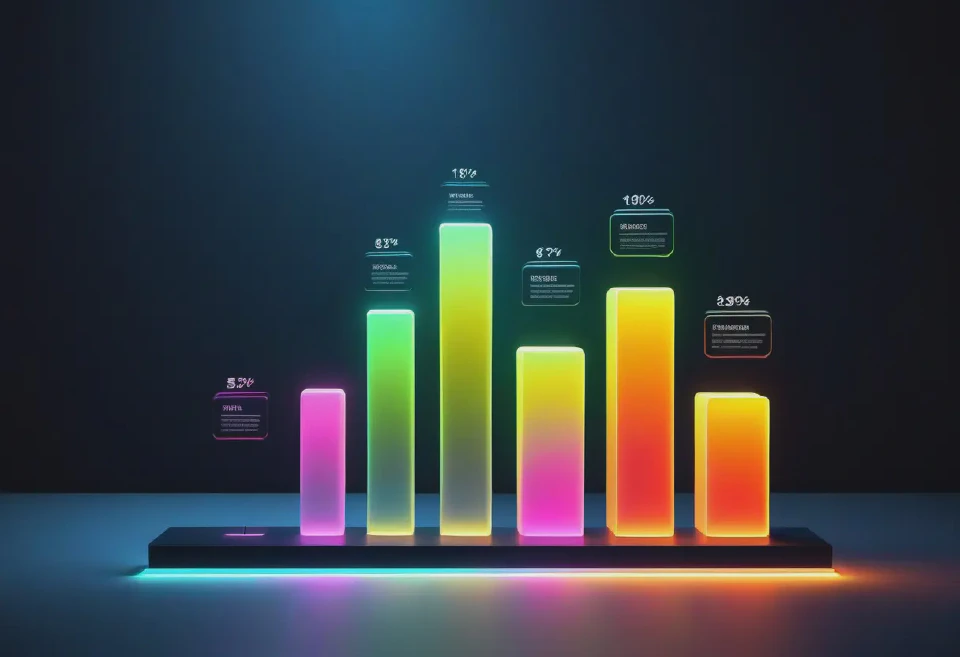
A bar graph made of 3D glowing neon bars, comparing electricity costs across the months of the year, set against a dark background to emphasize energy savings. Include interactive hover effects that display precise cost figures.
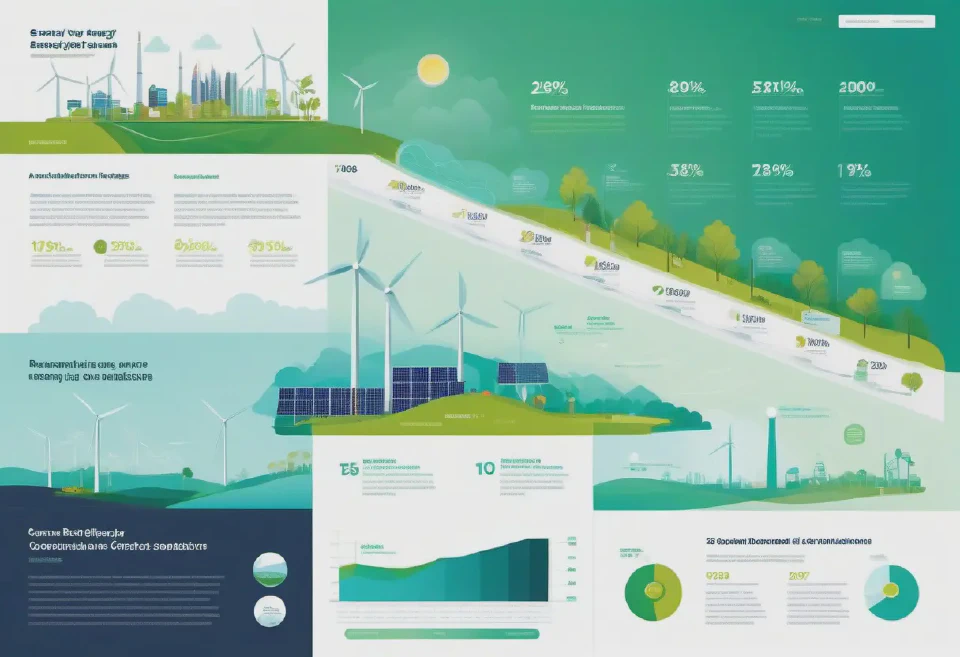
A visual timeline highlighting key milestones in energy conservation efforts and renewable energy project completions over the year, styled as an engaging, scroll-triggered web experience with animated elements and historical comparisons.
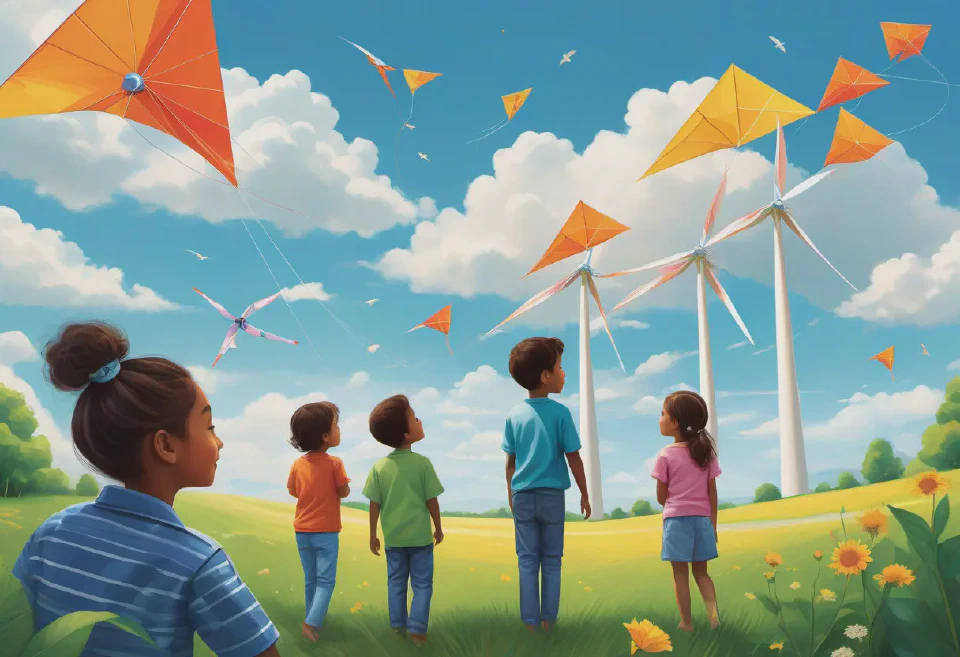
A digital art piece featuring children looking at a sky filled with kites shaped like solar panels and wind turbines. Motto: "Let's fly with clean energy, for their future."
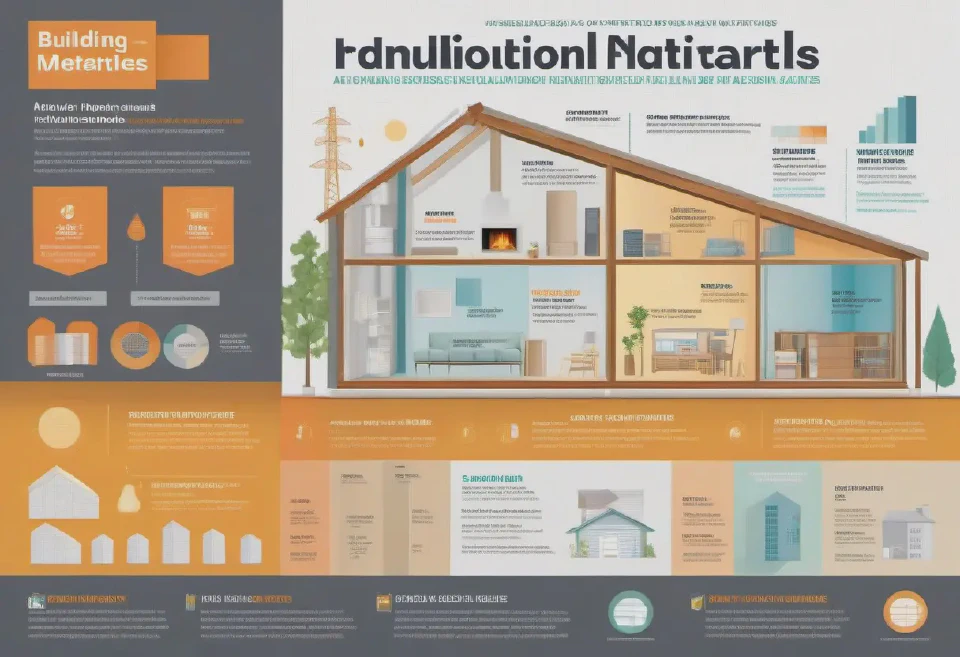
A detailed infographic comparing traditional building materials and their energy-efficient alternatives, including insulation values and cost savings over time.
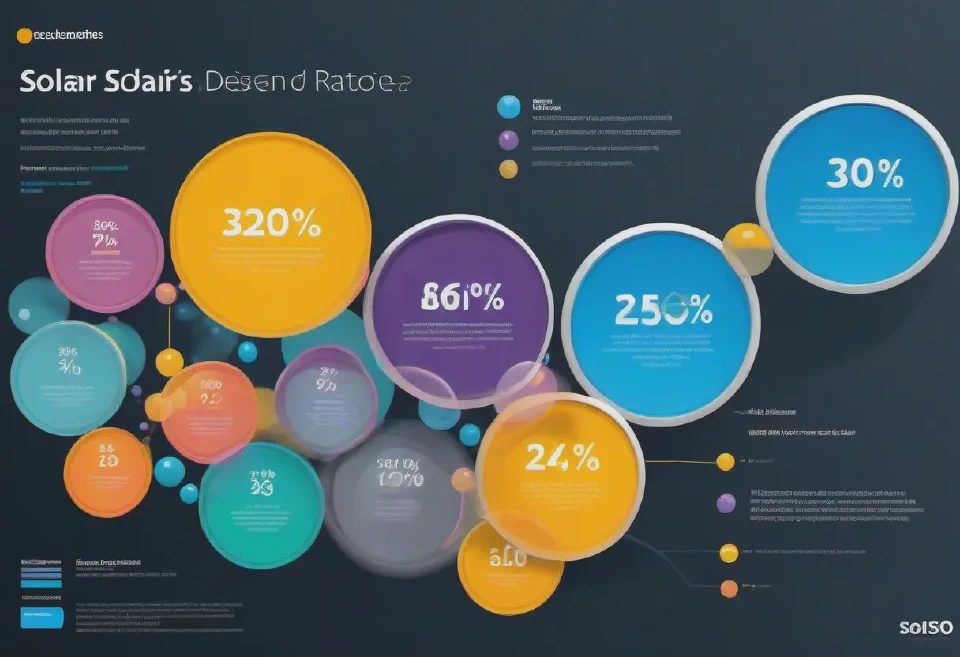
A bubble chart animation showing the efficiency of energy production by source (solar, wind, hydro, nuclear, coal, oil, and natural gas) over time from 2000 to 2023. The size of each bubble represents the amount of energy produced per unit of investment, and the position indicates the total energy production. Use a dynamic timeline control to explore changes over the years and implement pop-up labels with efficiency ratios and investment figures. Design the chart for interactive exploration on a web platform, with responsive design ensuring usability across different screen sizes.
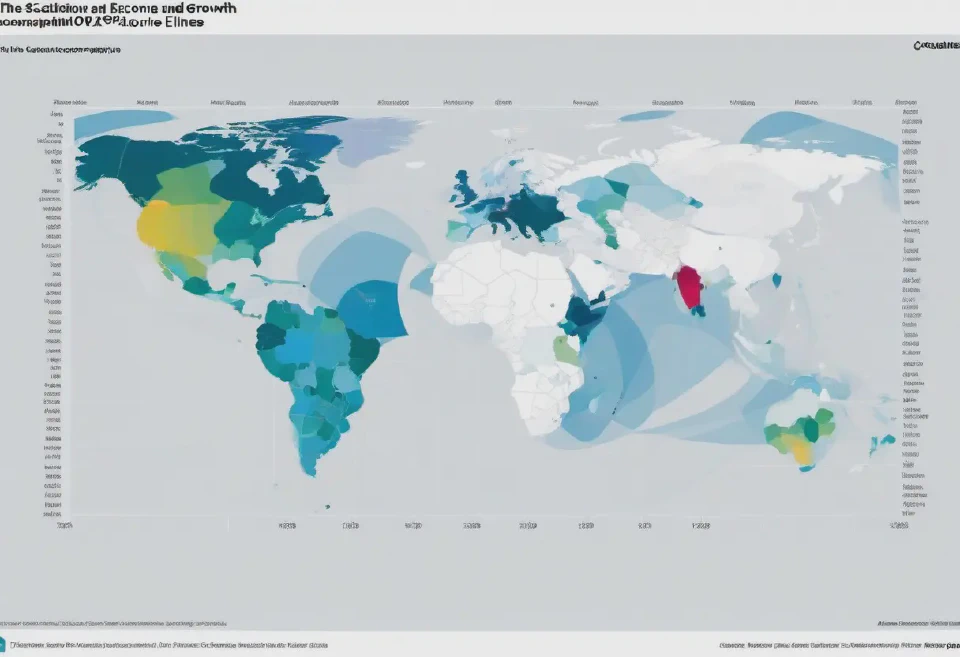
10. An interactive scatter plot showcasing "The Relationship Between Economic Growth and Energy Consumption over the Last 30 Years", with each point representing a different country, and options to filter by income group or region, including trend lines showing general patterns.
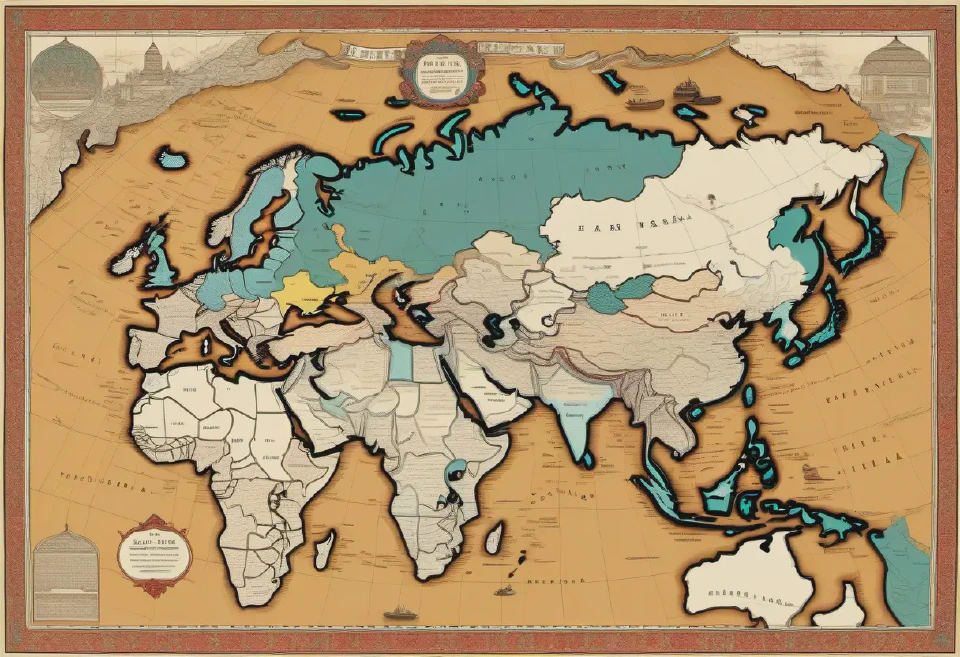
A vintage-style illustrated map showing the Silk Road and illustrating the exchange of goods, ideas, and legal practices between East and West, highlighting key historical figures and events related to trade laws.

10. "A detailed kitchen scene at breakfast, showcasing a manual coffee grinder and a French press beside a bowl of fruits, all lit by sunlight streaming through a window, promoting manual over electric appliances for energy conservation."
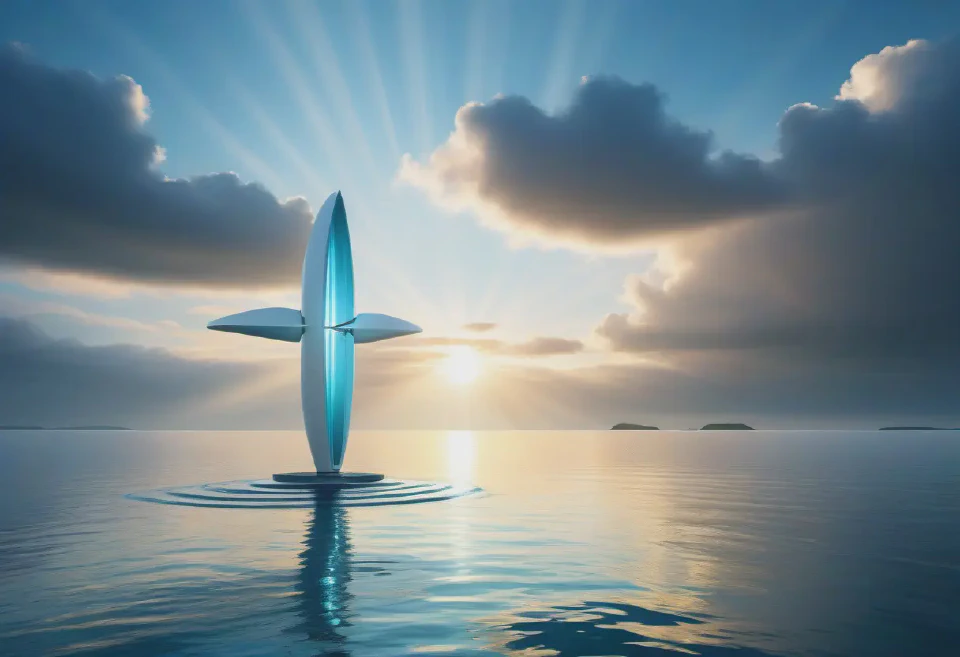
An inspirational concept art of a floating tidal energy generator on a calm sea at dawn, with rays of light breaking through the clouds, symbolizing hope and the endless possibilities of renewable energy technologies.
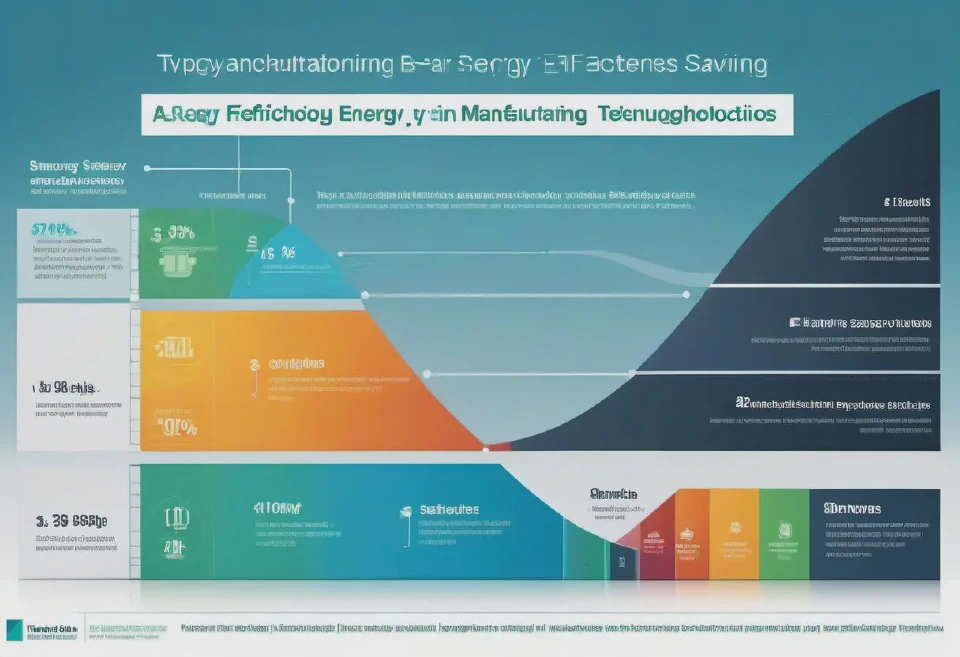
A comparative bar chart graphic illustrating typical energy savings achieved through various energy-efficient technologies in the manufacturing sector, with annotations explaining each technology.
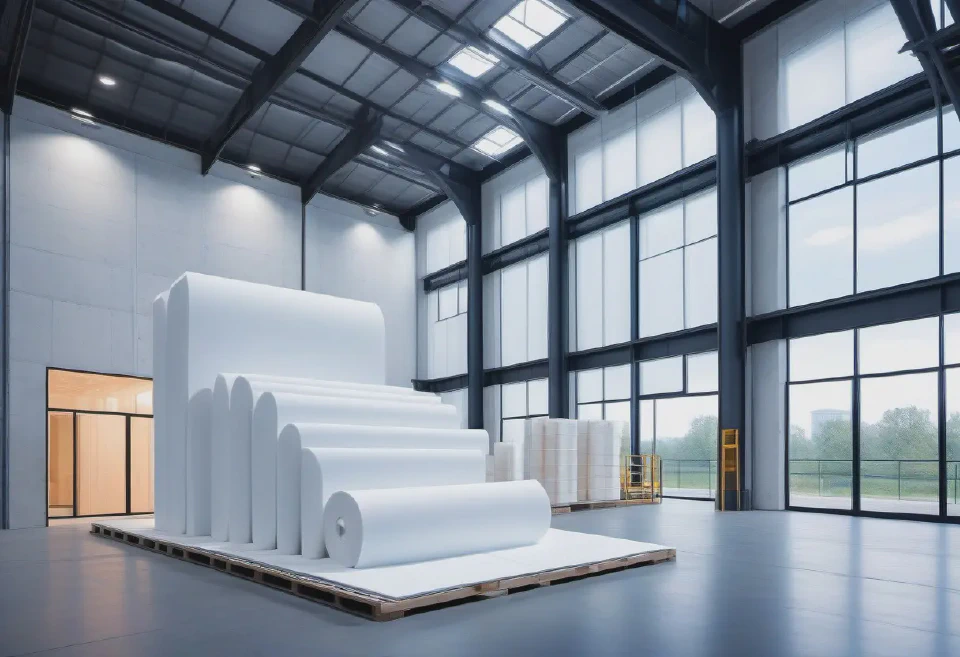
Industrial scale aerogel insulation application in a modern building, demonstrating thermal performance, material properties, and energy cost savings compared to traditional insulation methods, complete with architectural schematics.
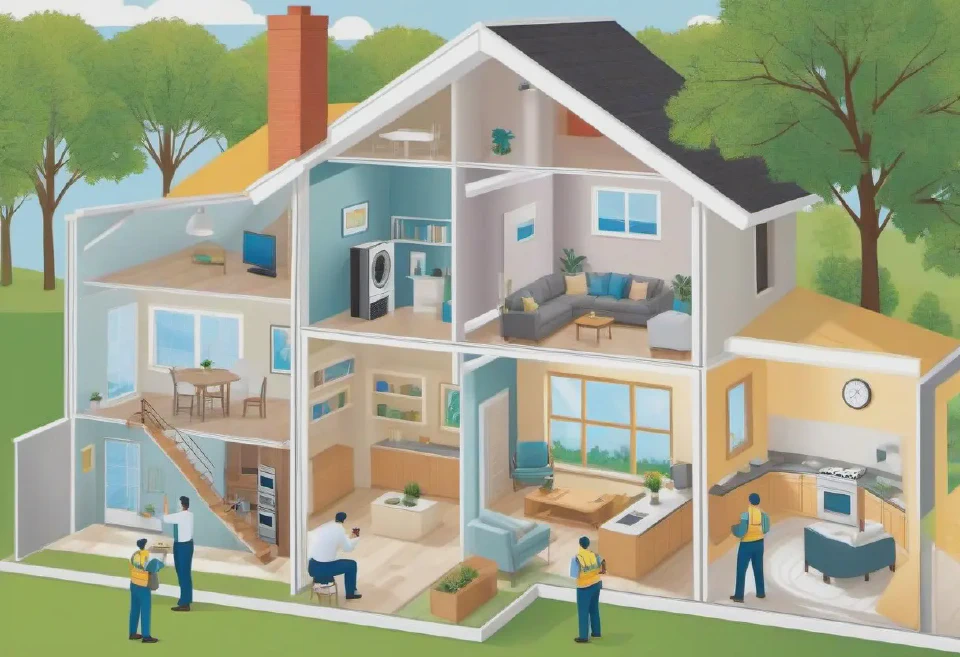
A step-by-step guide illustration showing how to conduct a DIY home energy audit. Include visuals of checking for leaks around windows and doors, inspecting insulation, measuring electricity usage of appliances, and checking the efficiency of heating and cooling systems.
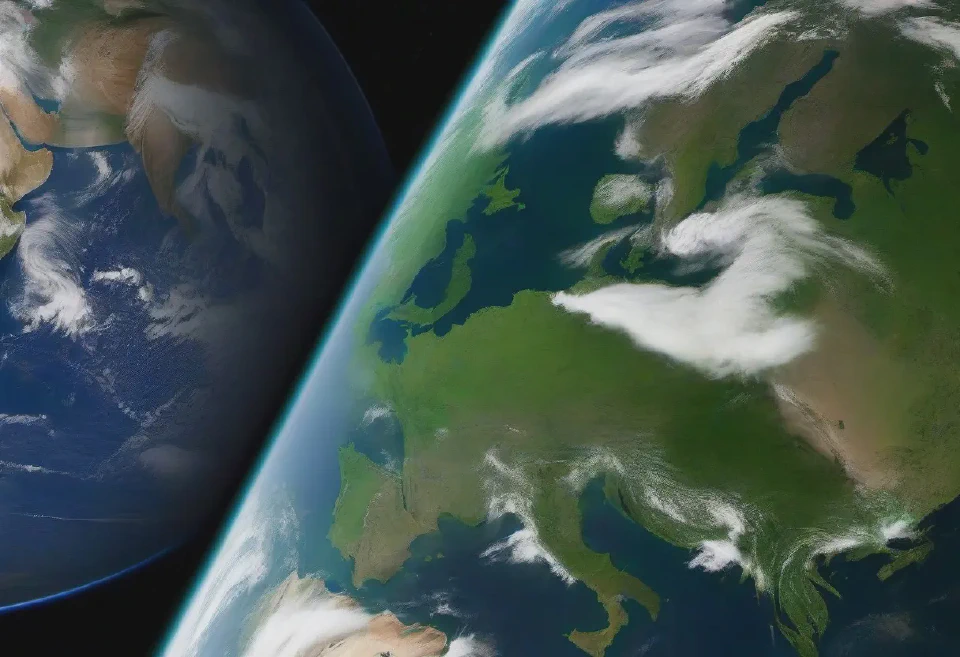
A dramatic before-and-after image of Earth from space: one side showing a polluted, dark planet, and the other a vibrant Earth powered by green energy, with a clear dividing line to emphasize the impact of energy conservation.
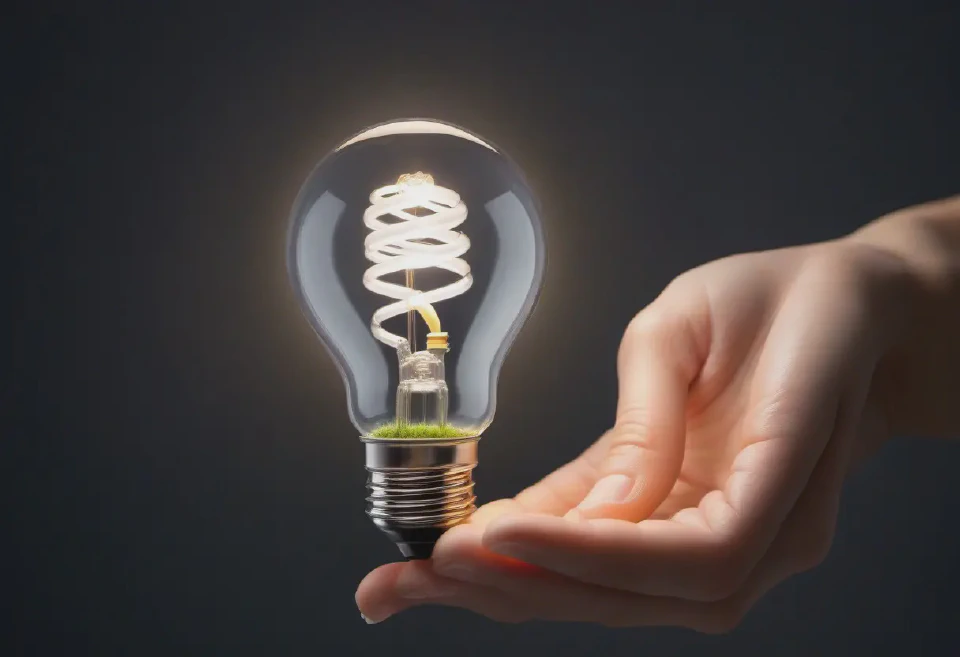
An elegant photograph of a hand holding a light bulb, inside of which is a miniature world powered by renewable energy, titled "Illuminate: Renewable Energy Art Exhibit". The date and venue details are presented in an imaginative, inspiring font.
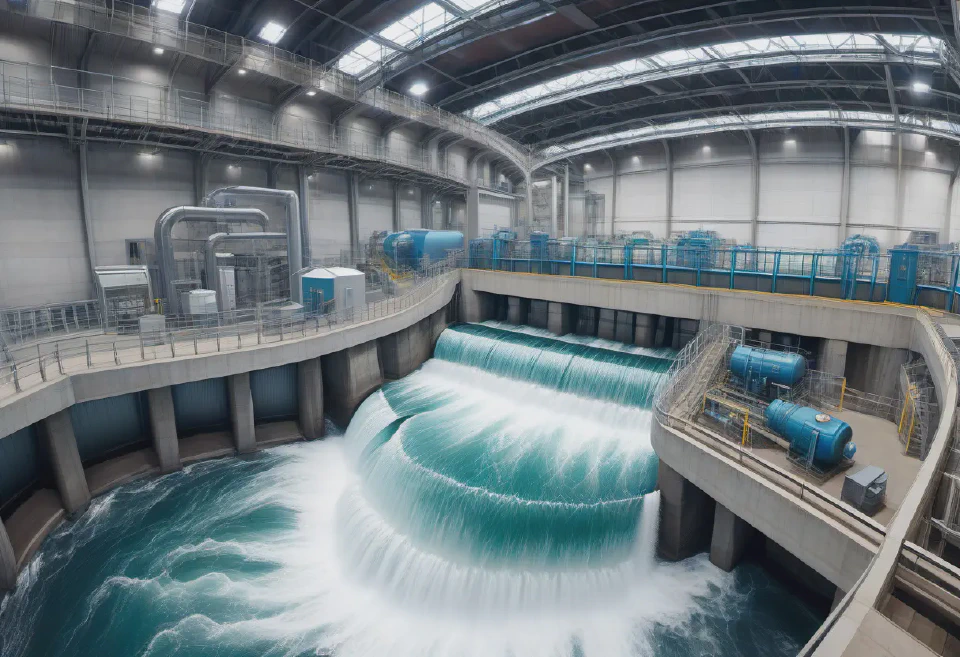
An immersive 360-degree virtual reality view of the inside of a hydropower plant, showcasing the turbines, control rooms, and the flowing water, in high detail and realism.
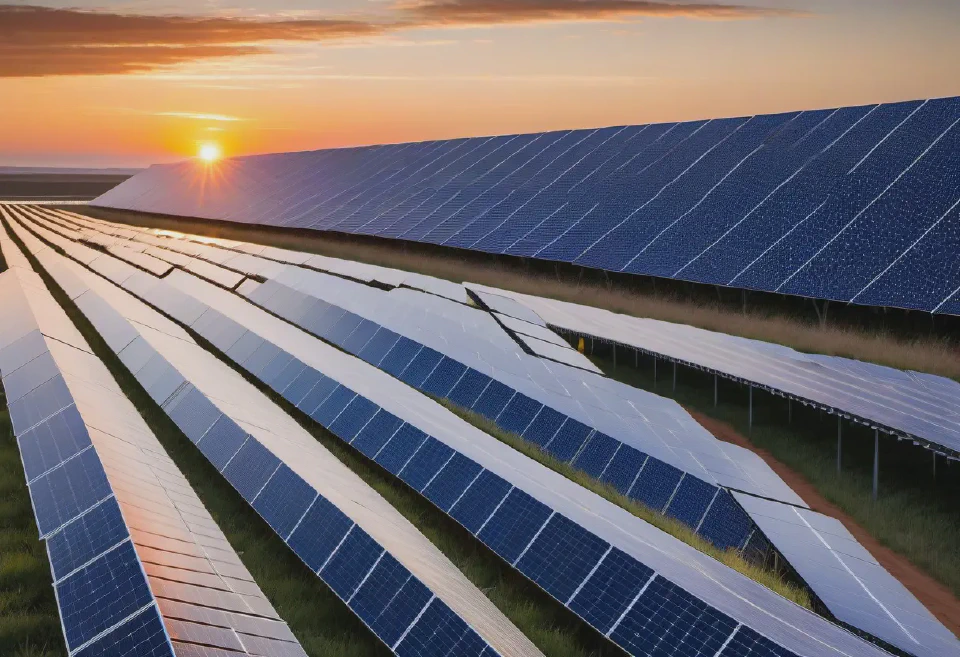
A solar farm at sunrise, showcasing rows of solar panels with a clear sky transitioning from orange to blue, highlighting the renewable energy source. Depth of field is shallow, focusing on the panels in the forefront.
A puzzle game interface where players connect different renewable energy sources (solar, wind, hydro) to power up a city grid. Each level gets more complex, requiring thoughtful planning to meet the city's energy demand without overflow or shortage.
A side-scrolling game environment set in a world where energy misuse has led to climate extremes. Players control a character implementing energy-saving measures (insulating homes, using public transport) while navigating through challenges posed by the harsh weather conditions.
An augmented reality (AR) app that overlays energy consumption data on household items through the phone's camera. Users can scan their home appliances, lighting, and other electronics to get tips on reducing energy use and improving efficiency, turning real-world actions into a gamified challenge.

A digital interactive book for children, featuring animated stories of characters solving energy conservation challenges in their daily lives (like choosing energy-efficient appliances, reducing water usage). Children can make choices for the characters, learning about the outcomes of different actions.
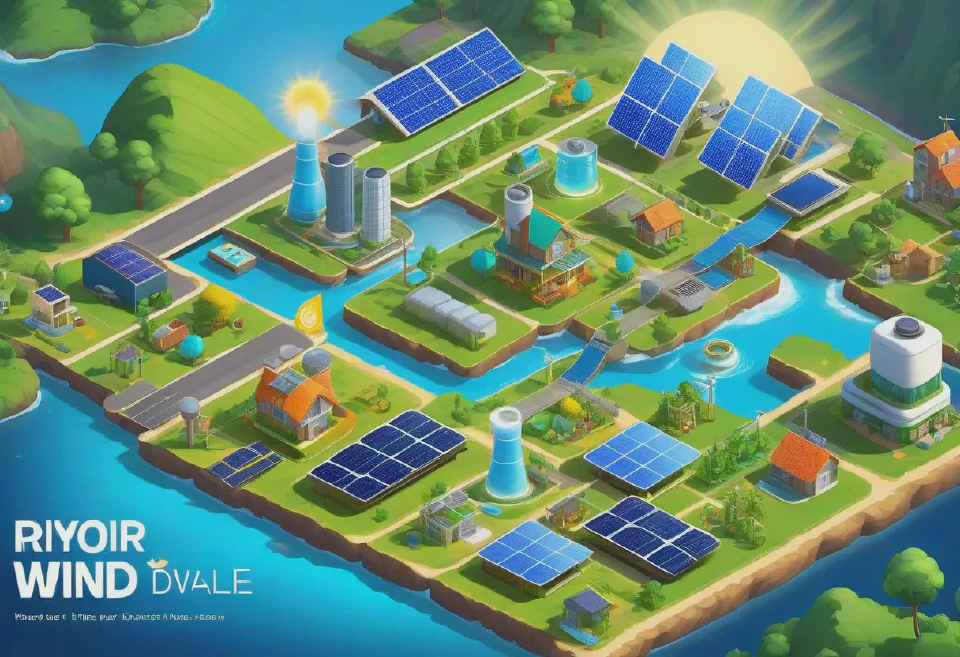
10. A composite landscape visual that juxtaposes an urban area powered by renewable energy sources against one relying on traditional energy. Highlight differences with contrasting color themes (greens and blues for renewable energy areas, reds and oranges for traditional energy areas) and include pop-up statistics on energy efficiency and savings throughout the scene.