Education & E-Learning
Generate images like this by single click. Just edit the text and regenerate the image to get a new one.
Generate images for education and e-learning projects.

10. The Renaissance era captured in a bustling Italian piazza, with artists, scholars, and citizens engaging in daily activities among iconic architecture, using rich colors and lighting to convey the vibrancy and intellectual spirit of the time.

A gamified map of a national park, including trails, landmarks, and wildlife, where users can collect points by answering quiz questions correctly to unlock levels and learn about conservation efforts.

A Venn diagram illustrating the similarities and differences between mitosis and meiosis, rendered with clear, easy-to-understand visuals and annotations, designed in a simple, educational style.

A diagrammatic representation of the binomial theorem expansion for (a+b)^4, using Pascal’s triangle for coefficients. Each term of the expansion should be aligned with the corresponding row in Pascal's triangle, with color-coding to highlight the connection.

A math class illustrated with a playful, cartoonish style, where complex concepts like geometry and algebra are represented by quirky characters interacting with students in a brightly colored classroom. The scene should appear fun, engaging, and designed to make math approachable.

A comprehensive climate zone map of the world, color-coded to show tropical, desert, temperate, polar, and Mediterranean regions, with icons representing typical flora and fauna for each zone.

10. "A waterfall chart illustrating a company's journey from initial investment to net profit over the fiscal year, with interactive breakdowns showing expenses, revenue streams, and net outcomes."

An infographic explaining the concept of derivatives in calculus, showing a curve, a tangent line at a point, and the corresponding slope calculation. The infographic should use contrasting colors to differentiate elements and include zoomed-in insets for detail.

10. Virtual reality behavioral therapy simulation for training healthcare professionals in dealing with patients with mental health issues, including scenarios for de-escalation techniques and therapeutic communication. Ensure the avatars have lifelike facial expressions and body language. Camera: First-person perspective as the healthcare professional.

A visually striking timeline depicting the advancements in medical sciences from ancient times to the modern day, highlighting key discoveries such as the invention of vaccines, the discovery of penicillin, and the development of DNA sequencing. Use detailed, lifelike illustrations to accompany each milestone.

A futuristic library filled with holographic books, representing the word "Knowledge" in multiple languages projected into the air among the shelves.

10. A vocabulary learning game interface, designed to be highly interactive with visual and auditory feedback, allowing for customization to include sign language videos or symbols for each word, serving as a valuable tool for students with diverse learning needs.

A diagram of the Kepler Space Telescope in orbit around the Earth, with annotations explaining its mission to discover Earth-size planets orbiting other stars. Detailed technical illustration with focus on instrumentation and orbit path.

A historical figure-themed flashcard lying on top of an open textbook, integrating QR codes that link to interactive content, seen in a high-resolution, close-up shot emphasizing the modern-meets-traditional study method.

5. A set of high-contrast flashcards featuring basic sign language gestures, with each card displaying a clear, easy-to-understand illustration of the gesture alongside a photo of the facial expression that accompanies it, for hearing-impaired students.

9. A large, durable floor puzzle of the solar system, with each planet featuring a unique texture and the names printed in both large print and braille, intended as a multi-sensory learning aid for students with visual impairments and others.

A detailed timeline mapping the major geological eras of Earth's history, from the Precambrian to the Cenozoic era, with illustrations representing significant evolutionary milestones, climate changes, and mass extinctions in each period. Aim for scientifically accurate, yet visually appealing imagery.

The Aurora Borealis over a pine forest, with a clear view of the magnetic fields in action, illustrating solar wind particles interacting with Earth's magnetosphere. Vivid colors, photorealistic quality.

2. A cross-sectional view of the human brain, highlighting different areas such as the cerebrum, cerebellum, and brain stem, with special focus on the functional significance of each area. Include color coding for different brain parts and annotations on the side.
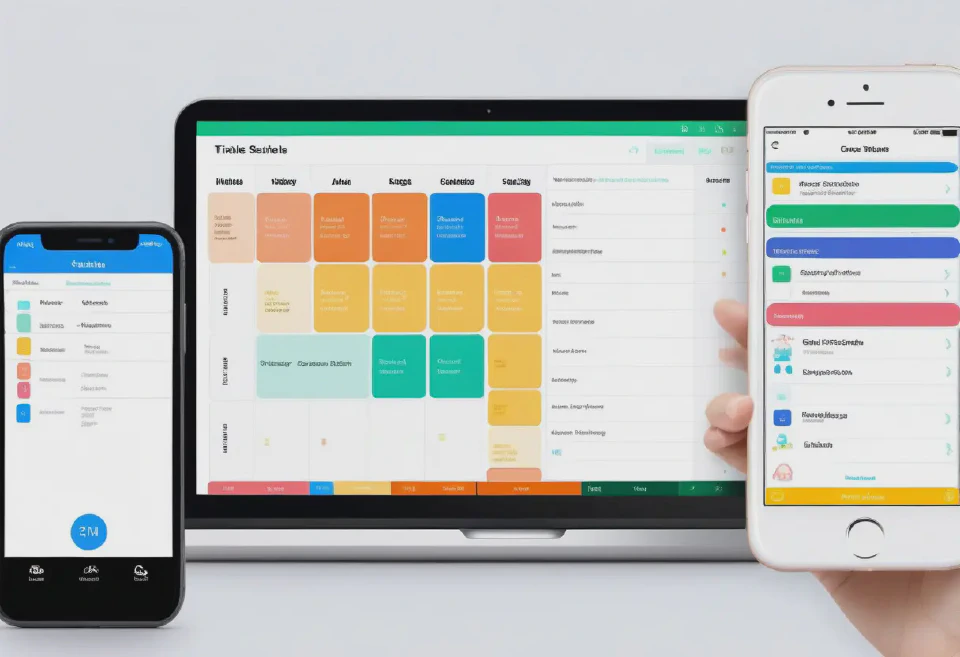
8. A customizable digital timetable app interface, visually structured and color-coded, with the option to add symbols or photos for each activity, aimed at assisting students with executive functioning disorders in managing their schedules.

6. An augmented reality (AR) app scene that projects a calming, underwater environment, complete with slowly moving sea creatures and soft, ambient sounds, intended as a de-escalation tool for students experiencing sensory overload.

A visually engaging timeline highlighting key events of the American Revolution, including the Boston Tea Party, Declaration of Independence, and Battle of Yorktown, with dates, brief descriptions, and vibrant illustrations for each event. High-quality images, bird's-eye view.

The Big Bang theory illustrated, starting from a single point and expanding outwards to show the formation of the universe, with key moments like the release of cosmic microwave background radiation highlighted. Dynamic, expanding perspective.

7. An infographic explaining different emotions with corresponding facial expressions, designed using simple, cartoon-style characters to help students with emotional and social challenges in recognizing and labeling their feelings.

A library filled with antique books, a student sitting at a desk creating flashcards on a laptop, sunlight filtering through the window. The scene gives off a cozy studying atmosphere. High-resolution, warm color tones.

A virtual chemical engineering lab simulation highlighting a distillation process, with detailed models of flasks, condensers, and heating equipment, alongside real-time temperature and pressure readings, aimed at college-level education.

A cross-sectional view of the Earth’s layers, detailed with annotations for the crust, mantle, outer core, and inner core, including key features like volcanoes and tectonic plates, to explain geological processes.

A vibrant coral reef ecosystem illustration from an underwater perspective, showing diverse marine life, coral species, and the clear, sunlight-penetrated turquoise waters of a tropical sea.

The life cycle of a star from nebula to supernova, illustrated in stages with side annotations for educational purposes. The sequence is shown against the backdrop of space to provide context.

1. A tactile alphabet chart for visually impaired students, featuring raised letters and braille annotations, set against a vivid, contrasting background to aid in distinguishing shapes and textures.
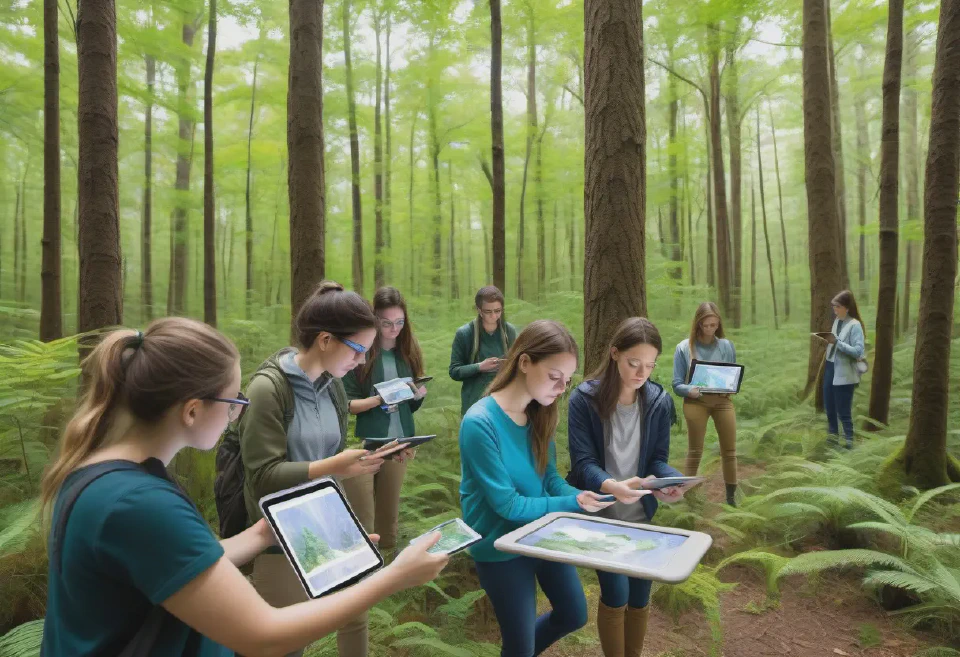
An outdoor environmental science class, with students using tablets to record observations. The illustration should include augmented reality overlays of wildlife and plant information on the tablets' screens, set in a vibrant, detailed forest setting.

A detailed illustration of the Solar System, including all eight planets, the Sun, and the asteroid belt, with labels. Realistic textures, viewed from a distance with a focus on scale and position.

A nebula illuminating a dark corner of the galaxy, showcasing hues of pink, blue, and purple, with distant stars twinkling around it. High resolution, vibrant colors.

An interactive physics lab simulation featuring a pendulum experiment setup with adjustable length and mass parameters, demonstrating the concept of periodic motion, viewed from a side angle with a ruler scale for precise measurement.

A group of students sitting in a circle on the grass in a sunny park, exchanging and discussing their custom flashcards. Candid shot, capturing the interaction and the environment.

2. A bright, colorful social story picture book detailing common daily routines, designed specifically for children with autism, with each page highlighting key steps with simple, understandable illustrations and minimal text.

A high mountain peak at sunrise, with "Adventure" written across the sky in various languages, using the clouds to form the letters.

A serene beach at sunset with soft golden light, featuring a single word "Peace" in various languages displayed in the sand.

A cozy coffee shop scene with a student sitting by the window, headphones on, creating digital flashcards on a laptop, surrounded by coffee and books. Soft focus background, cozy vibes.

A high-definition virtual biology lab, with a 3D model of an animal cell magnified on a digital screen, interactive tools like virtual microscopes, and detailed textures for cell organelles.

A computer lab where students are engaging in coding exercises, with screens showing custom illustrations of various programming concepts like loops and conditionals in a fun, cartoonish style. Make sure the room has a modern, tech-savvy feel with soft, ambient lighting.

A cozy coffee shop interior on a rainy day, showcasing the word "Comfort" in multiple languages on the steamy windows.

A geometric construction of a hexagon inside a circle, using only a compass and straightedge. The steps should be illustrated in sequential images, with each action clearly labeled and the final hexagon filled in with a soft, pastel color.

A detailed city map of Paris during the French Revolution, with clickable locations revealing historical facts, key figures, and important events of the era.

10. An interactive illustration of the human cell structure, including a detailed mitochondrion, nucleus, endoplasmic reticulum, and Golgi apparatus. Aim for a 3D model effect where students can visually explore different cell organelles, annotated with function descriptions.

3. "A multi-layered line graph showcasing the global average temperatures from 1900 to the present, with interactive timeline sliders allowing the viewer to explore specific years and annotations for significant climate events."

5. A dynamic scene of the first steam locomotive's maiden voyage, with billowing smoke and excited onlookers, capturing the revolutionary impact of the industrial era with vivid colors and motion.

An illustrated timeline focusing on the history of music, tracing its development from classical compositions through to contemporary pop and electronic music. Each era or significant breakthrough should be represented by iconic symbols, instruments, or portraits of key figures, with brief, informative descriptions.

3. A full-body skeletal system diagram with high precision, showing all major and minor bones, including the axial and appendicular skeletons. Make sure the labels are comprehensive, covering even the smaller bones in hands and feet, set against a neutral background.

3. An interactive digital whiteboard display showing a step-by-step process of solving a math problem, using clear, large fonts and symbols, complemented by voice narration for students with dyscalculia.

6. An educational illustration of the interior of an Ancient Egyptian pyramid, detailing the construction methods, hieroglyphs on the walls, and artifacts, with a perspective that leads the viewer's eye through the chambers.

An illustration of the solar system, showing planets orbiting the sun, with annotations for each planet’s name and a factoid, executed in a photorealistic style with accurate scale representation.

2. "A dynamic bar graph comparing the literacy rates across different continents over the past decade, with colors indicating increases or decreases, featuring hover-over effects for detailed statistics."

A mind map dedicated to the ecosystem of a rainforest, with branches for fauna, flora, climate, and conservation efforts, using vibrant illustrations and icons to represent each category.

A flowchart showcasing the water cycle, with vivid visuals such as rain, evaporation, condensation, and collection, each step connected by arrows indicating the process flow, rendered in a high-quality, illustrative style.